Chapter 1 Pattern Classification
1.1 What is Pattern Recognition?
It is generally easy for a person to differentiate the sound of a human voice, from that of a violin; a handwritten numeral "3," from an "8"; and the aroma of a rose, from that of an onion. However, it is difficult for a programmable computer to solve these kinds of perceptual problems. These problems are difficult because each pattern usually contains a large amount of information, and the recognition problems typically have an inconspicuous, high-dimensional, structure.
Pattern recognition is the science of making inferences from perceptual data, using tools from statistics, probability, computational geometry, machine learning, signal processing, and algorithm design. Thus, it is of central importance to artificial intelligence and computer vision, and has far-reaching applications in engineering, science, medicine, and business. In particular, advances made during the last half century, now allow computers to interact more effectively with humans and the natural world (e.g., speech recognition software). However, the most important problems in pattern recognition are yet to be solved [1].
It is natural that we should seek to design and build machines that can recognize patterns. From automated speech recognition, fingerprint identification, optical character recognition, DNA sequence identification, and much more, it is clear that reliable, accurate pattern recognition by machine would be immensely useful. Moreover, in solving the indefinite number of problems required to build such systems, we gain deeper understanding and appreciation for pattern recognition systems. For some problems, such as speech and visual recognition, our design efforts may in fact be influenced by knowledge of how these are solved in nature, both in the algorithms we employ and in the design of special-purpose hardware [2].
1.2 Basics
Feature can be defined as any distinctive aspect, quality or characteristic which, may be symbolic (i.e., color) or numeric (i.e., height). The combination of d features is represented as a d-dimensional column vector called a feature vector. The d-dimensional space defined by the feature vector is called feature space. Objects are represented as points in feature space. This representation is called a scatter plot [3].
Pattern is defined as composite of features that are characteristic of an individual. In classification, a pattern is a pair of variables {x,w} where x is a collection of observations or features (feature vector) and w is the concept behind the observation (label). The quality of a feature vector is related to its ability to discriminate examples from different classes (Figure 1.1). Examples from the same class should have similar feature values and while examples from different classes having different feature values.
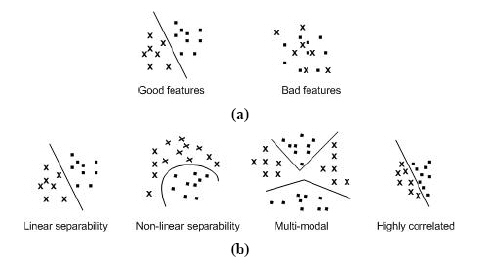 Figure 1.1: Characteristic (feature); a. the distinction between good and poor features, and b. feature properties.
|
The goal of a classifier is to partition feature space into class-labeled decision regions. Borders between decision regions are called decision boundaries (Figure 1.2).
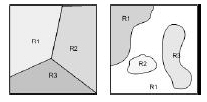 Figure 1.2: Classifier and decision boundaries. |
If the characteristics or attributes of a class are known, individual objects might be identified as belonging or not belonging to that class. The objects are assigned to classes by observing patterns of distinguishing characteristics and comparing them to a model member of each class. Pattern recognition involves the extraction of patterns from data, their analysis and, finally, the identification of the category (class) each of the pattern belongs to. A typical pattern recognition system contains a sensor, a preprocessing mechanism (segmentation), a feature extraction mechanism (manual or automated), a classification or description algorithm, and a set of examples (training set) already classified or described (post-processing)(Figure 1.3).
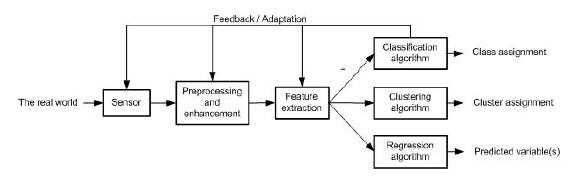 Figure 1.3: A pattern recognition system. |
1.3 An Example
To illustrate the complexity of some of the types of problems involved, let us consider the following example. Suppose that a fish-packing plant wants to automate the process of sorting incoming fish on a conveyor belt according to species. As a pilot project, it is decided to try to separate sea bass from salmon using optical sensing (Figure 1.4).
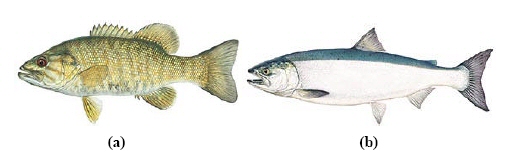 Figure 1.4: The objects to be classified; a. Sea bass, and b. salmon. |
We set up a camera (see Figure 1.5), take some sample images, and begin to note some physical differences between the two types of fish, length, lightness, width, number and shape of fins, position of the mouth, and so on, and these suggest features to explore for use in our classifier. We also notice noise or variations in the images, variations in lighting, and position of the fish on the conveyor, even static due to the electronics of the camera itself.
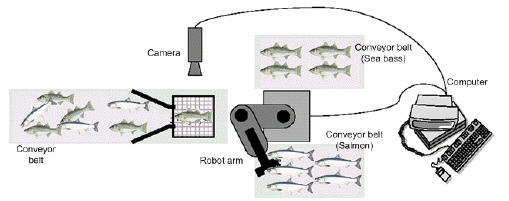 Figure 1.5: The fish-packing system. |
Given that there truly are differences between the population of sea bass and that of salmon, we view them as having different models, different descriptions, which are typically mathematical in form. The goal and approach in pattern classification is to hypothesize the class of these models, process the sensed data to eliminate noise, and for any sensed pattern choose the model that corresponds best.
In our prototype system, first, the camera captures an image of the fish (Figure 1.5). Next, the camera's signals are preprocessed to simplify subsequent operations without losing relevant information (Figure 1.3). In particular, we might use a segmentation operation in which the images of different fish are somehow isolated from one another and from the background. The information from a single fish is then sent to a feature extractor, whose purpose is to reduce the data by measuring certain features or properties. These features are then passed to a classifier that evaluates the evidence presented and makes a final decision as to the species.
The preprocessor might automatically adjust for average light level, or threshold the image to remove the background of the conveyor belt, and so forth. Suppose somebody at the fish plant tells us that a sea bass is generally longer than a salmon. These, then, give us our tentative models for the fish: Sea bass have some typical length, and this is greater than that for salmon. Then length becomes an obvious feature, and we might attempt to classify the fish merely by seeing whether or not, the length l of a fish exceeds some critical value l*. To choose l* we could obtain some design or training samples of the different types of fish, make length measurements, and inspect the results.
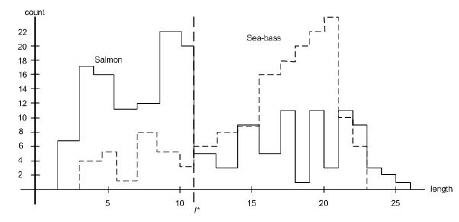 Figure 1.6: Histograms for the length feature for the two categories. The value marked l* will lead to the smallest number of errors. |
Suppose that we do this and obtain the histograms shown in Figure 1.6. These histograms bear out the statement that sea bass are somewhat longer than salmon, on average, but it is clear that this single criterion is quite poor; no matter how we choose l*, we cannot reliably separate sea bass from salmon by length alone.
Thus, we try another feature, namely the average lightness of the fish scales. Now we are very careful to eliminate variations in illumination, because they can only obscure the models and corrupt our new classifier. The resulting histograms and critical value x* shown in Figure 1.7 is much more satisfactory: The classes are much better separated.
So far we have assumed that the consequences of our actions are equally costly: Deciding the fish was a sea bass when in fact it was a salmon was just as undesirable as the converse. Such symmetry in the cost is often, but not invariably, the case. For instance, as a fish-packing company we may know that our customers easily accept occasional pieces of tasty salmon in their cans labeled “sea bass,” but they object vigorously if a piece of sea bass appears in their calls labeled “salmon.” If we want to stay in business, we should adjust our decisions to avoid antagonizing our customers, even if it means that more salmon makes its way into the cans of sea bass. In this case, then, we should move our decision boundary to smaller values of lightness, thereby reducing the number of sea bass that are classified as salmon (Figure 1.7). The more our customers object to getting sea bass with their salmon (i.e., the more costly this type of error) the lower we should set the decision threshold x* in Figure 1.7.
Such considerations suggest that there is an overall single cost associated with our decision, and our true task is to make a decision rule (i.e., set a decision boundary) to minimize such a cost. This is the central task of decision theory of which, pattern classification is perhaps the most important subfield.
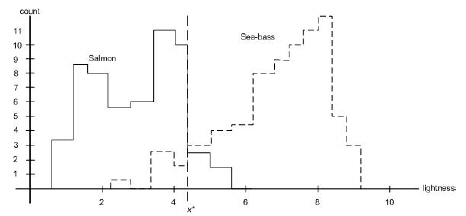 Figure 1.7: Histograms for the lightness feature for the two categories. The value marked x* will lead to the smallest number of errors. |
Even if we know the costs associated with our decisions and choose the optimal critical value x*, we may be dissatisfied with the resulting performance. Our first impulse might be to seek yet a different feature on which to separate the fish. Let us assume, however, that no other single visual feature yields better performance than that based on lightness. To improve recognition, then, we must resort to the use of more than one feature at a time.
In our search for other features, we might try to capitalize on the observation that sea bass are typically wider than salmon. Now we have two features for classifying fish-the lightness x1 and the width x2. We realize that the feature extractor has thus reduced the image of each fish to a point or feature vector x in a two dimensional feature space, where

|
(1.1) |
Our problem now is to partition the feature space into two regions, where for all points in one region we will call the fish a sea bass, and for all points in the other, we call it a salmon. Suppose that we measure the feature vectors for our samples and obtain the scattering of points shown in Figure 1.8. This plot suggests the following rule for separating the fish: Classify the fish as sea bass if its feature vector falls above the decision boundary shown, and as salmon otherwise.
This rule appears to do a good job of separating our samples and suggests that perhaps incorporating yet more features would be desirable. Besides the lightness and width of the fish, we might include some shape parameter, such as the vertex angle of the dorsal fin, or the placement of the eyes and so on. How do we know beforehand which of these features will work best? Some features might be redundant. For instance, if the eye-color of all fish correlated perfectly with width, then classification performance need not be improved if we also include eye color as a feature.
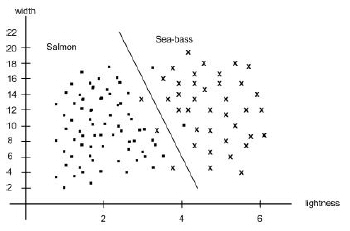 Figure 1.8 : The two features of lightness and width for sea bass and salmon. |
Suppose that other features are too expensive to measure, or provide little in the approach described above, and that we are forced to make our decision based on the two features. If our models were extremely complicated, our classifier would have a decision boundary more complex than the simple straight line. In that case, all the training patterns would be separated perfectly, as shown in Figure 1.9. With such a solution, though, our satisfaction would be premature because the central aim of designing a classifier is to suggest actions when presented with new patterns, that is, fish not yet seen. This is the issue of generalization. It is unlikely that the complex decision boundary in Figure 1.9 would provide good generalization; it seems to be tuned to the particular training samples rather than some underlying characteristics or true model of all the sea bass and salmon that will have to be separated.
Naturally, one approach would be to get more training samples for obtaining a better estimate of the true underlying characteristics, for instance the probability distributions of the categories. In some pattern recognition problems, however, the amount of such data we can obtain easily is often quite limited. Even with a vast amount of training data in a continuous feature space though, if we followed the approach in Figure 1.9 our classifier would give a complicated decision boundary; one that would be unlikely to do well on new patterns.
Rather, then, we might seek to simplify the recognizer, motivated by a belief that the underlying models will not require a decision boundary that is as complex as that in Figure 1.9. Indeed, we might be satisfied with the slightly poorer performance on the training samples if it means that our classifier will have better performance on new patterns.
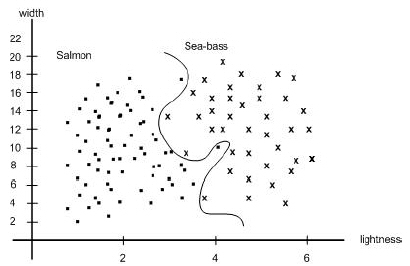 Figure 1.9: The two features of lightness and width for sea bass and salmon. |
This makes it quite clear that our decisions are fundamentally task-or cost¬ specific, and that creating a single general purpose artificial pattern recognition device-that is, one capable of acting accurately based on a wide variety of tasks is a profoundly difficult challenge. This should give us added appreciation of the ability of humans to switch rapidly and fluidly between pattern recognition tasks.
It was necessary in our fish example to choose our features carefully, and hence achieve a representation (as in Figure 1.10) that enabled reasonably successful pattern classification. A central aspect in virtually every pattern recognition problem is that of achieving such a “good” representation, one in which the structural relationships among the components are simply and naturally revealed, and one in which the true (unknown) model of the patterns can be expressed. In some cases, patterns should be represented as vectors of real-valued numbers, in others ordered lists of attributes, in yet others, descriptions of parts and their relations, and so forth. We seek a representation in which the patterns that lead to the same action are somehow close to one another, yet far from those that demand a different action. The extent to which we create or learn a proper representation and how we quantify near and far apart will determine the success of our pattern classifier. A number of additional characteristics are desirable for the representation. We might wish to favor a small number of features, which might lead to simpler decision regions and a classifier easier to train. We might also wish to have features that are robust, that is, relatively insensitive to noise or other errors. In practical applications, we may need the classifier to act quickly, or use few-electronic components, memory, or processing steps.
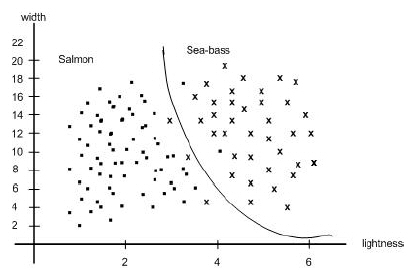 Figure 1.10: The decision boundary shown might represent the optimal tradeoff between performance on the training set and simplicity of classifier, thereby giving the highest accuracy on new patterns. |
1.4 Approaches to Pattern Recognition
There are two fundamental approaches for implementing a pattern recognition system: statistical and structural. Each approach employs different techniques to implement the description and classification tasks. Hybrid approaches, sometimes referred to as a unified approach to pattern recognition, combine both statistical and structural techniques within a pattern recognition system [4].
Statistical pattern recognition draws from established concepts in statistical decision theory to discriminate among data from different groups based upon quantitative features of the data. There are a wide variety of statistical techniques that can be used within the description task for feature extraction, ranging from simple descriptive statistics to complex transformations. Examples of statistical feature extraction techniques include mean and standard deviation computations, frequency count summarizations, Karhunen-Lóeve transformations, Fourier transformations, wavelet transformations, and Hough transformations. The quantitative features extracted from each object for statistical pattern recognition are organized into a fixed length feature vector where the meaning associated with each feature is determined by its position within the vector (i.e., the first feature describes a particular characteristic of the data, the second feature describes another characteristic, and so on). The collection of feature vectors generated by the description task are passed to the classification task. Statistical techniques used as classifiers within the classification task include those based on similarity (e.g., template matching, k-nearest neighbor), probability (e.g., Bayes rule), boundaries (e.g., decision trees, neural networks), and clustering (e.g., k-means, hierarchical).
The quantitative nature of statistical pattern recognition makes it difficult to discriminate (observe a difference) among groups based on the morphological (i.e., shape based or structural) subpatterns and their interrelationships embedded within the data. This limitation provided the impetus for the development of a structural approach to pattern recognition that is supported by psychological evidence pertaining to the functioning of human perception and cognition. Object recognition in humans has been demonstrated to involve mental representations of explicit, structure-oriented characteristics of objects, and human classification decisions have been shown to be made on the basis of the degree of similarity between the extracted features and those of a prototype developed for each group. For instance, the recognition by components theory explains the process of pattern recognition in humans: (1) the object is segmented into separate regions according to edges defined by differences in surface characteristics (e.g., luminance, texture, and color), (2) each segmented region is approximated by a simple geometric shape, and (3) the object is identified based upon the similarity in composition between the geometric representation of the object and the central tendency of each group. This theorized functioning of human perception and cognition serves as the foundation for the structural approach to pattern recognition.
Structural pattern recognition, sometimes referred to as syntactic pattern recognition due to its origins in formal language theory, relies on syntactic grammars to discriminate among data from different groups based upon the morphological interrelationships (or interconnections) present within the data. Structural features, often referred to as primitives, represent the subpatterns (or building blocks) and the relationships among them which constitute the data. The semantics associated with each feature are determined by the coding scheme (i.e., the selection of morphologies) used to identify primitives in the data. Feature vectors generated by structural pattern recognition systems contain a variable number of features (one for each primitive extracted from the data) in order to accommodate the presence of superfluous structures which have no impact on classification. Since the interrelationships among the extracted primitives must also be encoded, the feature vector must either include additional features describing the relationships among primitives or take an alternate form, such as a relational graph, that can be parsed by a syntactic grammar.
The emphasis on relationships within data makes a structural approach to pattern recognition most sensible for data which contain an inherent, identifiable organization such as image data (which is organized by location within a visual rendering) and time-series data (which is organized by time); data composed of independent samples of quantitative measurements, lack ordering and require a statistical approach. Methodologies used to extract structural features from image data such as morphological image processing techniques result in primitives such as edges, curves, and regions; feature extraction techniques for time-series data include chain codes, piecewise linear regression, and curve fitting which are used to generate primitives that encode sequential, time-ordered relationships. The classification task arrives at an identification using parsing: the extracted structural features are identified as being representative of a particular group if they can be successfully parsed by a syntactic grammar. When discriminating among more than two groups, a syntactic grammar is necessary for each group and the classifier must be extended with an adjudication scheme so as to resolve multiple successful parsings.
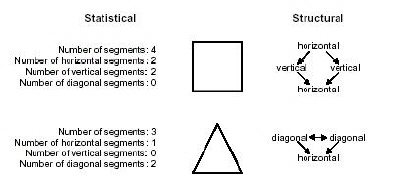 Figure 1.11: The statistical and structural approaches to pattern recognition applied to a common identification problem. The goal is to discriminate between the square and the triangle. A statistical approach extracts quantitative features which are assembled into feature vectors for classification with a decision-theoretic classifier. A structural approach extracts morphological features and their interrelationships, encoding them in relational graphs; classification is performed by parsing the relational graphs with syntactic grammars. |
Figure 1.11 demonstrates how both approaches can be applied to the same identification problem. The goal is to differentiate between the square and the triangle. A statistical approach extracts quantitative features such as the number of horizontal, vertical, and diagonal segments which are then passed to a decision-theoretic classifier. A structural approach extracts morphological features and their interrelationships within each figure. Using a straight line segment as the elemental morphology, a relational graph is generated and classified by determining the syntactic grammar that can successfully parse the relational graph. In this example, both the statistical and structural approaches would be able to accurately distinguish between the two geometries. In more complex data, however, discriminability is directly influenced by the particular approach employed for pattern recognition because the features extracted represent different characteristics of the data.
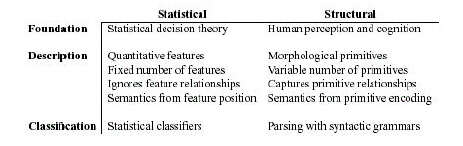
A summary of the differences between statistical and structural approaches to pattern recognition is shown in Table 1.1. The essential dissimilarities are two-fold: (1) the description generated by the statistical approach is quantitative, while the structural approach produces a description composed of subpatterns or building blocks; and (2) the statistical approach discriminates based upon numeric differences among features from different groups, while grammars are used by the structural approach to define a language encompassing the acceptable configurations of primitives for each group. Hybrid systems can combine the two approaches as a way to compensate for the drawbacks of each approach, while conserving the advantages of each. As a single level system, structural features can be used with either a statistical or structural classifier. Statistical features cannot be used with a structural classifier because they lack relational information, however statistical information can be associated with structural primitives and used to resolve ambiguities during classification (e.g., as when parsing with attributed grammars) or embedded directly in the classifier itself (e.g., as when parsing with stochastic grammars). Hybrid systems can also combine the two approaches into a multilevel system using a parallel or a hierarchical arrangement.
Table 1.1: A summary of the differences between statistical and structural approaches to pattern recognition. Due to their divergent theoretical foundations, the two approaches focus on different data characteristics and employ distinctive techniques to implement both the description and classification tasks.
|
1.5 Pattern Recognition Systems
In describing our hypothetical fish classification system, we distinguished between the three different operations of preprocessing, feature extraction and classification (see Figure 1.3). To understand the problem of designing such a system, we must understand the problems that each of these components must solve [2].
1.5.1 Sensing
The input to a pattern recognition system is often some kind of a transducer, such as a camera or a microphone array. The difficulty of the problem may well depend on the characteristics and limitations of the transducer- its bandwidth, resolution, sensitivity, distortion, signal-to-noise ratio, latency, etc.
1.5.2 Segmentation and Grouping
In our fish example, we assumed that each fish was isolated, separate from others on the conveyor belt, and could easily be distinguished from the conveyor belt. In practice, the fish would often be overlapping, and our system would have to determine where one fish ends and the next begins-the individual patterns have to be segmented. If we have already recognized the fish then it would be easier to segment their images. How can we segment the images before they have been categorized, or categorize them before they have been segmented? It seems we need a way to know when we have switched from one model to another, or to know when we just have background or no category. How can this be done? Segmentation is one of the deepest problems in pattern recognition. Closely related to the problem of segmentation is the problem of recognizing or grouping together the various pans of a composite object.
1.5.3 Feature Extraction
The conceptual boundary between feature extraction and classification proper is somewhat arbitrary: An ideal feature extractor would yield a representation that makes the job of the classifier trivial; conversely, an omnipotent classifier would not need the help of a sophisticated feature extractor The distinction is forced upon us for practical rather than theoretical reasons.
The traditional goal of the feature extractor is to characterize an object to be recognized by measurements whose values are very similar for objects in the same category, and very different for objects in different categories. This leads to the idea of seeking distinguishing features that are invariant to irrelevant transformations of the input. In our fish example, the absolute location of a fish on the conveyor belt is irrelevant to the category, and thus our representation should be insensitive to the absolute location of the fish. Ideally, in this case we want the features to be invariant to translation, whether horizontal or vertical. Because rotation is also irrelevant for classification, we would also like the features to be invariant to rotation. Finally, the size of the fish may not be important- a young, small salmon is still a salmon. Thus, we may also want the features to be invariant to scale. In general, features that describe properties such as shape, color, and many kinds of texture are invariant to translation, rotation, and scale.
The problem of finding rotation invariant features from an overhead intage of a fish on a conveyor belt is simplified by the fact that the fish is likely to be lying flat, and the axis of rotation is always parallel to the camera’s line of sight. A more general invariance would be for rotations about an arbitrary line in three dimensions. The image of even such a simple object as a coffee cup undergoes radical variation, as the cup is rotated to an arbitrary angle. The handle may become occluded-that is, hidden by another part. The bottom of the inside volume conic into view, the circular lip appear oval or a straight line or even obscured, and so forth. Furthermore, if the distance between the cup and the camera can change, the image is subject to projective distortion. How might we ensure that the features are invariant to such complex transformations? On the other hand, should we define different subcategories for the image of a cup and achieve the rotation invariance at a higher level of processing?
As with segmentation, the task of feature extraction is much more problem- a domain-dependent than is classification proper, and thus requires knowledge of the domain, A good feature extractor for sorting fish would probably be of little use identifying fingerprints, or classifying photomicrographs of blood cells. However, some of the principles of pattern classification can be used in the design of the feature extractor.
1.5.4 Classification
The task of the classifier component proper of a full system is to use the feature vector provided by the feature extractor to assign the object to a category. Because perfect classification performance is often impossible, a more general task is to determine the probability for each of the possible categories. The abstraction provided by the feature-vector representation of the input data enables the development of a largely domain-independent theory of classification.
The degree of difficulty of the classification problem depends on the variability in the feature values for objects in the same category relative to the difference between feature values for objects in different categories. The variability of feature values for objects in the same category may be due to complexity, and may be due to noise. We define noise in very general terms: any property of the sensed pattern, which is not due to the true underlying model but instead to randomness in the world or the sensors. All nontrivial decision and pattern recognition problems involve noise in some form.
One problem that arises in practice is that it may not always be possible to determine the values of all of the features for a particular input. In our hypothetical system for fish classification, for example, it may not be possible to determine width of the fish because of occlusion by another fish. How should the categorizer compensate? Since our two-feature recognizer never had a single-variable criterion value x* determined in anticipation of the possible absence of a feature, how shall it make the best decision using only the feature present? The naive method of merely assuming that the value of the missing feature is zero or the average of the values for the patterns already seen is provably nonoptimal. Likewise, how should we train a classifier or use one when some features are missing?
1.5.5 Post Processing
A classifier rarely exists in a vacuum. Instead, it is generally to be used to recommend actions (put this fish in this bucket, put that fish in that bucket), each action having an associated cost. The post-processor uses the output of the classifier to decide on the recommended action.
Conceptually, the simplest measure of classifier performance is the classification error rate-the percentage of new patterns that are assigned to the wrong category. Thus, it is common to seek minimum-error-rate classification. However, it may be much better to recommend actions that will minimize the total expected cost, which is called the risk. How do we incorporate knowledge about costs and how will this affect our classification decision? Can we estimate the total risk and thus tell when our classifier is acceptable even before we field it? Can we estimate the lowest possible risk of any classifier; to see how close ours meets this ideal, or whether the problem is simply too hard overall?
In our fish example we saw how using multiple features could lead to improved recognition. We might imagine that we could also do better if we used multiple classifiers, each classifier operating on different aspects of the input.
REFERENCES
[1] Snapp R., CS 295: Pattern Recognition, Course Notes, Department of Computer Science, University of Vermont, (http://www.cs.uvm.edu/~snapp/teaching/CS295PR/whatispr.html)
[2] Duda, R.O., Hart, P.E., and Stork D.G., (2001). Pattern Classification. (2nd ed.). New York: Wiley-Interscience Publication.
[3] Gutierrez-Osuna R., Intelligent Sensor Systems, Course Notes, Department of Computer Science, Wright State University, (http://research.cs.tamu.edu/prism/lectures/iss/iss_l9.pdf)
[4] Olszewski R. T. (2001) Generalized Feature Extraction for Structural Pattern Recognition in TimeSeries Data, PhD. Thesis at School of Computer Science, Carnegie Mellon University, Pittsburgh.